PylonMon
Monitor. Alert. Act. Repeat.

Reliable monitoring for what actually matters.

Keep your websites, APIs, servers, and critical workflows running. Get alerted the moment something’s wrong — so you can move fast and stay ahead.
  • No credit card required
  • Built by people who run production
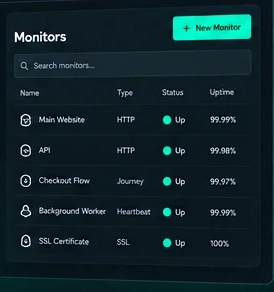
Example monitors with their status and uptimeBuddy, the PylonMon mascot, waving Always
watching
for you.
Works with the tools you already run
SlackDiscordMicrosoft TeamsPagerDutyPrometheusZapierntfy… and any webhook

Uptime Monitoring

Keep your websites and services online. Get alerted instantly when something goes down.

Learn more →

Server Monitoring

Monitor your infrastructure, servers, and critical systems in one place. No open ports, works behind NAT.

Learn more →

Synthetic Journeys

Simulate real user flows in a real browser and validate that everything works — from login to checkout.

Learn more →

Smart Alerting

Get notified via Slack, Discord, email, SMS, voice and more. Every failure is re-checked first, so you are paged once.

Learn more →
Overall uptime
99.99% ↑ +0.01%
All systems operational for 30 days
From insights to action

More than uptime checks.

PylonMon helps you monitor what matters, detect issues early, and give your team the confidence to ship and scale.

  • Uptime, API, and heartbeat checks
  • Synthetic monitoring (user journeys)
  • Flexible alerting and integrations
  • Status pages and incident tracking
  • Built for individuals, teams, and growing businesses
How it works

From issue to resolution, faster.

Detect issues, get alerted, take action, and keep your services running — all in one place.

Buddy, healthy1. MonitorKeep an eye on what matters.
Buddy, warning2. Get alertedOnly when it matters.
Buddy, down3. Take actionFix issues faster.
Buddy, asleep4. Keep goingMore uptime. Happier users.
Secure & PrivateYour data is encrypted and never shared.
Built by EngineersCreated by people who run production systems.
Here for the Long RunA sustainable, independent company.

Simple pricing

Start free. Upgrade to Pro when you need more journeys, faster checks and a second region confirming before you’re paged. Flat monthly pricing, never per seat.

The price on this page is the price on your invoice. No per-host meters, no metered browser runs, no usage tier that spikes the month something goes wrong. Detection, alerting and incidents are one product here, not three.

Free
$0 / forever
  • 1 customer journey — a real browser walks your checkout every 15 minutes
  • 20 monitors
  • Log search — 1-day retention, 50 MB/day
  • 1 alert channel — email, Discord, Slack, webhook, ntfy or web push
  • 1-minute check intervals
  • Heartbeat, HTTP/S, TCP & ping monitors
  • pylon-beacon — 3 nodes (CPU/mem/disk/temp, open source)
  • Escalation ladders
  • 24-hour event history
Get started
Pro
$9 / month
  • 2 customer journeys, every 5 minutes
  • 75 monitors
  • 10 alert channels
  • Multi-region confirmation — an outage is verified from a second region before we page you, so a one-region routing blip never wakes you
  • Log search — 7-day retention, 1 GB/day
  • 30-second check intervals
  • pylon-beacon nodes up to your monitor cap — with vital threshold alerts
  • Prometheus & Alertmanager — metric monitors (push or pull) + your alerts as monitors (up to 25 alert streams)
  • SMS allowance each month
  • + DNS, UDP, TLS-cert & domain expiry, slow-response monitors
  • Incidents, public status page & API
  • Custom webhook payloads & maintenance windows
  • Scrape your monitors into your own Prometheus
  • 30-day event history + CSV export
  • Priority email support
  • Capacity blocks — +25 monitors $5/mo · +5 journeys $10/mo, prepaid, added by you, never an overage
Start Pro
Team
$30 / month
  • 10 customer journeys, every 5 minutes — +5 for $10/mo, prepaid
  • 250 monitors
  • 200 alert channels
  • Everything in Pro
  • On-call rotations — shifts, overrides, page-whoever-is-on
  • Company-scale Prometheus — up to 200 inbound alert streams (Pro caps at 25)
  • Bigger SMS allowance
  • Telegram alerts · WhatsApp (planned)
  • Teammates & roles (up to 5)
  • 90-day event history
  • Log search & live tail — 30-day retention, 5 GB/day
  • Capacity blocks — +25 monitors $5/mo · +5 journeys $10/mo, prepaid, never an overage
Start Team
Want a walkthrough? Email setup@pylonmon.com and we'll set up a call.
Enterprise
from $99 / month

For organizations with security, compliance, availability and support requirements beyond the standard plans: custom limits, an SLA, a security review with an engineer.

  • 1000 monitors
  • Unlimited alert channels
  • Log search — 90-day retention, 20 GB/day (soft — talk to us past that)
  • Everything in Team
  • Bring-your-own-AI — alerts page your agent (MCP endpoint + agent-scoped keys); it writes findings back to the incident
  • Voice-call alerts & on-call voice paging
  • Unlimited teammates — invited or SSO-provisioned, no seat wall
  • Enterprise SSO (OIDC)
  • Largest SMS allowance
  • 24/7 priority support — round-the-clock, ahead of every other queue
  • Customer journeys negotiated — sized to your flows and regions
Talk to us
Just need the features? Start Enterprise self-serve at $99. Security review first? Security & trust.
Every plan includes real support — a person answers, not a bot. And we will never sell your data. Launch pricing is locked for early customers — if these prices go up later, yours doesn't. See how we compare →

Questions, answered

The things people ask before signing up.

What is journey monitoring?

A journey is a short script — click Sign in, fill Email, click Checkout, expect Order summary — that PylonMon runs in a real browser from outside your network every few minutes. If a step fails you are paged with the step, the error and a screenshot. It catches the failures an uptime check cannot see: a login that errors, a checkout button that does nothing, a signup form that stopped submitting.

Is there a free plan?

Yes — Free is free forever: one customer journey, 20 monitors, 1-minute checks, heartbeat, HTTP/S, TCP and ping monitors and one alert channel. No credit card required.

What is heartbeat (dead-man's-switch) monitoring?

Your cron jobs, backups, and scripts send a quick HTTP ping to a unique URL when they finish. If PylonMon doesn't hear from a job inside its expected window, it pages you — the silence is the signal, so you catch jobs that die quietly.

Do I need to install an agent?

No. PylonMon watches from off-site: journeys run in our browsers, heartbeats are a single curl line, and HTTP, TCP and ping checks run from our side. The open-source pylon-beacon agent is optional, for CPU, memory, disk and logs from inside a machine.

How is PylonMon different from UptimeRobot or Healthchecks.io?

It does both at once — outbound uptime checks and inbound heartbeat/cron monitoring — plus escalation ladders on every plan, multi-region outage confirmation on every paid plan, on-call rotations on Team, Prometheus and Alertmanager support, and alerts to email, Discord, Slack, SMS, WhatsApp and voice.

What alert channels are supported?

Email, Discord, Slack, Teams, Webex, Telegram, ntfy.sh, web push, SMS, WhatsApp, voice calls, Zapier and any webhook — with escalation on every plan and one alert per state change, no 2am nag loops.

Can it monitor cron jobs and backups?

Yes — heartbeat monitors are built for exactly that. Add one curl line to the end of your job; miss the schedule and you're alerted with how long it's been silent.